Wind Energy vs Building Energy Upgrade
(BER G -> B3)
| Turbine | Cut-In | Output (kWh/h) |
% Cap | Annual |
|---|
Infrastructure Competition: Physical vs Virtual
60 Years
The Physical Turbine
1 Unit (1.0 MW)
€0 M
⚠ Grid Stress: High (Requires Upgrades)
Cost to build, run & decommission 4 times over 60 years.
The 'Virtual' Turbine
0 Units (Homes)
€0 M
✓ Grid Relief: High (Reduces Load)
Aggregate savings of retrofitting 0 homes (G to B3 rating).
Wind Farm Sizing
60m
0.00 km²
(0 Hectares)
0 MWh/km²
Land Efficiency:
0
Retrofits / km²
0 retrofits preserves 1 km² of unspoilt countryside.
1 Turbine (at selected speed) = 0 Retrofits
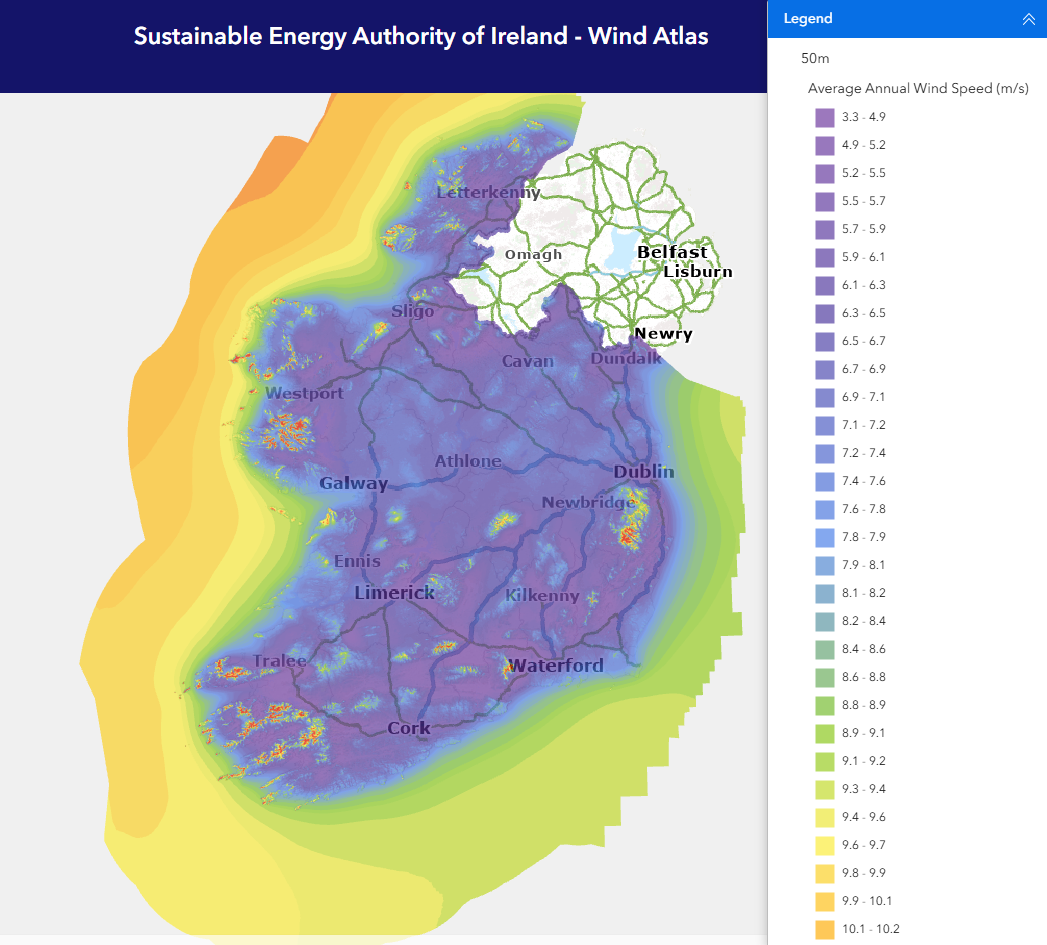
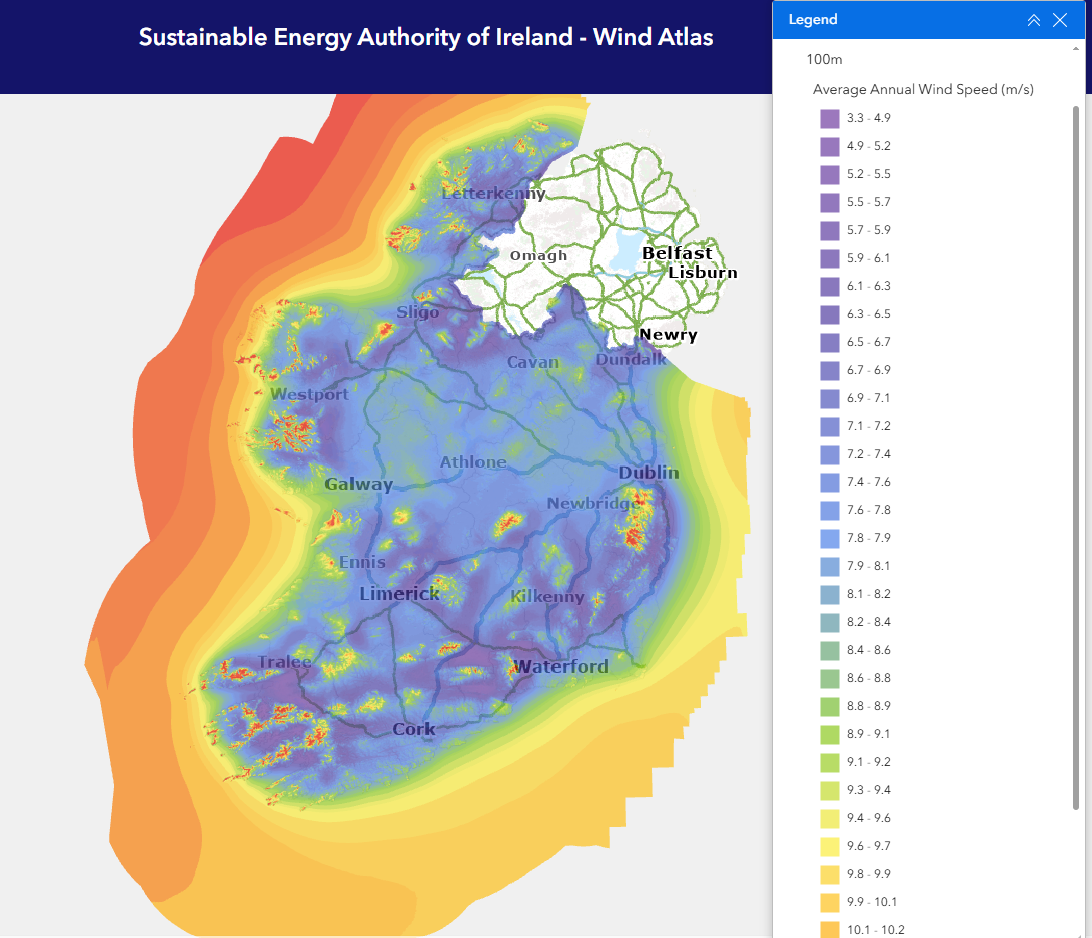
SEAI Wind Atlas
Select Height above Ground (m) to get SEAI average wind speed (m/s) colour mapping